Stable electricity is the backbone of modern electronics, yet it is rarely perfect. Voltage sags, harmonic distortion, and frequency fluctuations can destroy sensitive industrial equipment or corrupt data centers. This is where a Power Quality Analyzer becomes essential. It is the diagnostic tool that reveals the invisible health of an electrical system.
For engineers and manufacturers, understanding this device goes beyond just reading a screen. It involves understanding the hardware architecture, the PCB layout requirements for high-precision measurement, and the manufacturing standards required to build them. At APTPCB (APTPCB PCB Factory), we specialize in fabricating the high-reliability circuit boards that power these sophisticated instruments. This guide covers everything from the fundamental definitions to the manufacturing checkpoints required to build or select a high-performance analyzer.
Key Takeaways
- Definition: A Power Quality Analyzer monitors electrical parameters to detect disturbances that deviate from the ideal sine wave (AC) or steady state (DC).
- Core Metrics: Total Harmonic Distortion (THD), Power Factor, and Voltage Transients are the top three indicators of system health.
- Hardware Criticality: The accuracy of an analyzer depends heavily on the PCB stackup, isolation, and signal integrity of the Power Analyzer PCB.
- Differentiation: An AC Power Analyzer focuses on grid synchronization, while a DC Power Analyzer focuses on ripple and battery efficiency.
- Manufacturing Tip: High-voltage isolation slots and heavy copper layers are often required for the internal PCBs of these devices.
- Validation: Calibration against a known standard is the only way to verify the data integrity of the analyzer.
What Power Quality Analyzer really means (scope & boundaries)
To understand how to measure power quality, we must first define the scope of what a Power Quality Analyzer actually detects. It is not simply a multimeter that gives a snapshot of voltage. It is a continuous monitoring device that captures high-speed events and long-term trends.
The Core Function
The primary function is to compare the actual electrical waveform against an ideal waveform. In an AC system, the ideal is a pure 50Hz or 60Hz sine wave. In a DC system, the ideal is a flat, ripple-free voltage line. The analyzer detects deviations such as:
- Amplitude issues: Sags (dips) or Swells (surges).
- Waveform issues: Harmonics or noise.
- Frequency issues: Drift from the standard grid frequency.
AC vs. DC Analysis
The hardware requirements differ based on the application.
- AC Power Analyzer: Used for grid monitoring, motor drives, and transformers. It must handle high voltages (often up to 1000V) and calculate complex power factors.
- DC Power Analyzer: Used for solar arrays, electric vehicles, and battery storage. It focuses on efficiency, ripple voltage, and step response.
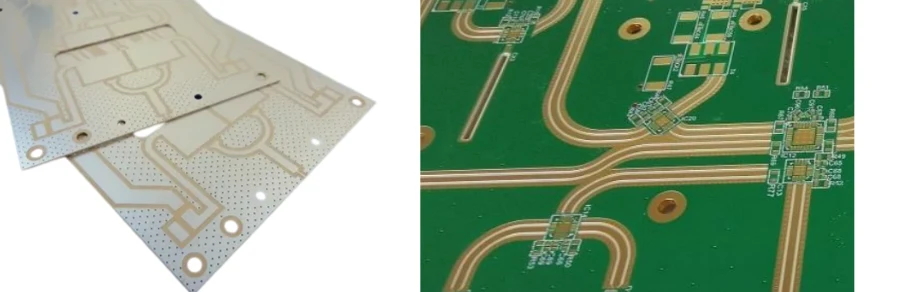
The PCB Role
Inside every handheld or rack-mount analyzer is a complex Power Analyzer PCB. This board must process high-voltage inputs while protecting the sensitive low-voltage logic circuits (FPGA or Microcontroller). The design of this PCB determines the safety rating (CAT III/IV) and the measurement precision of the final device.
Metrics that matter (how to evaluate quality)
Once the scope of the device is defined, we must focus on the specific data points that determine power quality. A Power Quality Analyzer is only as good as the metrics it can accurately capture.
| Metric | Why it matters | Typical Range / Factors | How to measure |
|---|---|---|---|
| Voltage Sags/Swells | Short-term drops or spikes can reset computers or trip relays. | ±10% of nominal voltage is standard; beyond this is an event. | RMS calculation over one half-cycle. |
| Total Harmonic Distortion (THD) | Harmonics cause overheating in transformers and neutral conductors. | < 5% is good; > 8% indicates significant pollution. | FFT (Fast Fourier Transform) analysis of the waveform. |
| Power Factor (PF) | Indicates how efficiently power is being used. Low PF wastes energy. | 1.0 is ideal. < 0.85 usually incurs utility penalties. | Ratio of Real Power (kW) to Apparent Power (kVA). |
| Transients (Spikes) | Microsecond-level spikes can destroy semiconductor components instantly. | Can reach thousands of volts for microseconds. | High-speed sampling (>200kHz) triggers. |
| Frequency Stability | Generators must stay synced. Deviation damages rotating machines. | 50/60Hz ±0.5Hz. | Zero-crossing detection circuits. |
| Flicker (Pst) | Rapid voltage changes cause lights to flicker and annoy humans. | Pst < 1.0 is the limit of human perception. | Demodulation of voltage envelope. |
| Unbalance | Uneven load on 3-phase systems causes motor vibration and heat. | < 2% voltage unbalance is recommended. | Comparison of phase-to-phase voltages. |
Selection guidance by scenario (trade-offs)
Understanding these metrics helps you choose the right hardware configuration for your specific environment. Not all analyzers are built the same; a Battery Analyzer PCB has different design constraints than a grid monitor.
1. Industrial Motor Drives (VFDs)
- Challenge: Variable Frequency Drives (VFDs) generate massive electrical noise and harmonics.
- Requirement: You need an analyzer with high bandwidth to capture the PWM (Pulse Width Modulation) switching frequencies.
- Trade-off: Higher bandwidth usually increases the cost and reduces battery life in portable units.
2. Renewable Energy (Solar/Wind)
- Challenge: Inverters constantly switch between DC and AC.
- Requirement: A hybrid analyzer capable of simultaneous AC and DC measurement.
- Trade-off: These units are complex and require specialized current sensors (Hall Effect) rather than standard CTs.
3. Data Center Power Distribution
- Challenge: Detecting very fast transients that could reboot servers.
- Requirement: High sampling rate and large memory depth to record events over weeks.
- Trade-off: Large data files require advanced software for post-processing.
4. Portable Field Testing
- Challenge: Technicians need to carry the device safely into hazardous zones.
- Requirement: CAT IV 600V safety rating and ruggedized enclosure.
- Trade-off: Rugged units often have smaller screens or fewer interface ports to maintain isolation.
5. R&D Lab Bench
- Challenge: Developing high-efficiency power supplies requires extreme precision.
- Requirement: High accuracy (0.05% or better) and integration with PC software.
- Trade-off: These are usually bulky, mains-powered, and not suitable for field work.
6. Battery Health Monitoring
- Challenge: Assessing the internal resistance and discharge curve of cells.
- Requirement: A specialized Battery Analyzer PCB design that handles high current discharge loads.
- Trade-off: Focused solely on DC; cannot analyze grid harmonics.
From design to manufacturing (implementation checkpoints)
Selecting the right application is useless if the underlying hardware design is flawed or manufactured poorly. For engineers designing a Power Quality Analyzer, or for procurement teams sourcing the PCBs, specific manufacturing checkpoints are non-negotiable.
At APTPCB, we see many designs fail because they ignore the physical realities of high-voltage PCB fabrication.
1. High-Voltage Isolation (Creepage and Clearance)
- Recommendation: Maintain strict spacing between high-voltage inputs and low-voltage logic.
- Risk: Arcing can occur if dust or humidity bridges the gap.
- Acceptance: Use PCB milling (slots) between high-voltage pads to increase creepage distance.
2. Layer Stackup and Grounding
- Recommendation: Use a multi-layer laminated structure with dedicated ground planes.
- Risk: Poor grounding introduces noise, making the analyzer "measure itself" rather than the signal.
- Acceptance: Verify impedance control on ADC lines.
3. Thermal Management for Shunts
- Recommendation: Current measurement shunts generate heat. Use heavy copper or thermal vias.
- Risk: Temperature drift changes the resistance of the shunt, ruining accuracy.
- Acceptance: Thermal simulation or IR testing during prototyping.
4. Signal Integrity for High-Speed ADCs
- Recommendation: Route analog signals as differential pairs away from switching power supplies.
- Risk: Crosstalk will appear as "ghost" harmonics in the data.
- Acceptance: Signal integrity simulation and clean eye diagrams.
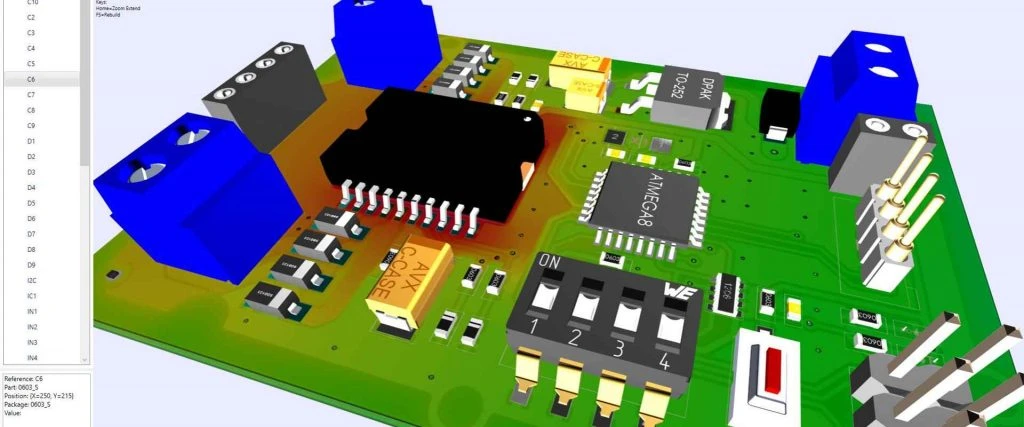
5. Component Selection and Placement
- Recommendation: Place decoupling capacitors as close to the IC pins as possible.
- Risk: Voltage drops on the power rail during high-speed sampling.
- Acceptance: Automated Optical Inspection (AOI) to ensure precise placement.
6. EMI Shielding
- Recommendation: Use metal cans or internal PCB shielding layers.
- Risk: External RF interference (e.g., from a phone) distorts readings.
- Acceptance: EMC compliance testing.
7. Material Selection
- Recommendation: Use High Tg PCB material for stability under thermal stress.
- Risk: Standard FR4 may expand too much, stressing solder joints.
- Acceptance: Verify Tg rating in the material datasheet (e.g., Tg > 170°C).
8. Final Assembly Protection
- Recommendation: Apply conformal coating to the PCBA.
- Risk: Field analyzers are exposed to moisture and dust.
- Acceptance: Visual inspection under UV light to check coating coverage.
Common mistakes (and the correct approach)
Even with a robust design process, specific oversights can compromise the measurement accuracy of a Power Quality Analyzer. Avoiding these pitfalls ensures the data collected is actionable.
Confusing Ground with Neutral
- Mistake: Assuming Ground and Neutral are the same potential.
- Correction: Always measure Neutral-to-Ground voltage. High N-G voltage indicates bonding issues or leakage.
Inadequate Sampling Rate (Aliasing)
- Mistake: Using an analyzer with a low sampling rate to measure high-frequency noise.
- Correction: Ensure the sampling rate is at least 10x the highest frequency of interest (Nyquist theorem is the bare minimum; 10x is practical).
Ignoring Current Clamp Specs
- Mistake: Using a 1000A clamp to measure 5A of current.
- Correction: Accuracy degrades at the bottom of the range. Match the sensor to the load.
Neglecting Temperature Drift
- Mistake: Calibrating the device at 25°C but using it at 50°C inside a factory.
- Correction: Use low-PPM drift components and perform temperature compensation in software.
Overlooking Safety Ratings (CAT Levels)
- Mistake: Using a CAT II device on the service entrance (CAT IV zone).
- Correction: Never compromise on safety. An arc flash can be fatal. Ensure the PCB design supports the required CAT rating.
Confusing Antenna Analyzers with Power Analyzers
- Mistake: Searching for an Antenna Analyzer PCB when you need to measure grid power.
- Correction: An antenna analyzer measures RF impedance (50 ohms) for radio transmission. A power analyzer measures 50/60Hz energy. They are totally different frequency domains.
Poor Data Granularity
- Mistake: Recording only 15-minute averages.
- Correction: You will miss short transients. Configure the analyzer to capture "events" based on thresholds, not just averages.
FAQ
Beyond these technical pitfalls, engineers often ask about operational specifics and manufacturing details.
Q: What is the difference between Class A and Class S analyzers? A: Class A follows strict IEC 61000-4-30 standards for accuracy and time synchronization, suitable for legal disputes. Class S is for statistical surveys and has looser tolerances.
Q: Can a Power Quality Analyzer detect loose connections? A: Indirectly. A loose connection often causes heat (detectable by IR) and voltage sags or erratic resistance changes under load.
Q: How often should a Power Quality Analyzer be calibrated? A: Typically once a year. Testing and Quality protocols suggest regular validation to ensure the components haven't drifted.
Q: Does APTPCB manufacture the entire analyzer or just the PCB? A: We specialize in the PCB fabrication and assembly (PCBA). We work with OEMs who design the instruments.
Q: What is the difference between a Power Analyzer and an Oscilloscope? A: An oscilloscope shows the waveform shape. A power analyzer calculates power parameters (Watts, VARs, PF) directly and offers isolation that most standard scopes lack.
Q: Can I use a standard FR4 material for a Power Analyzer PCB? A: For low-voltage handheld units, yes. For high-precision or high-voltage units, we recommend high-performance materials to ensure stability and safety.
Q: Why is "Antenna Analyzer PCB" often confused with this topic? A: Both use the term "Analyzer" and deal with impedance. However, an Antenna Analyzer PCB operates in the MHz range for radio tuning, while power quality is in the Hz to kHz range.
Q: What data do I need to provide for a PCB quote? A: We need the Gerber files, BOM (Bill of Materials), and specific requirements for stackup and impedance control.
Glossary (key terms)
To navigate the specifications of a Power Quality Analyzer, familiarity with these terms is essential.
| Term | Definition |
|---|---|
| Active Power (kW) | The actual power consumed by the load to do useful work. |
| Apparent Power (kVA) | The vector sum of Active and Reactive power. The total power supplied. |
| Crest Factor | The ratio of the peak value of a waveform to its RMS value. Indicates stress on insulation. |
| Dip (Sag) | A sudden reduction in voltage (usually 10% to 90%) for a short duration. |
| Harmonics | Voltages or currents at frequencies that are integer multiples of the fundamental frequency (e.g., 150Hz is the 3rd harmonic of 50Hz). |
| Interharmonics | Frequencies that are not integer multiples of the fundamental. Often caused by cycloconverters. |
| Noise | Unwanted electrical signals less than 200kHz superimposed on the power system. |
| Notching | A periodic voltage disturbance caused by the normal operation of power electronics (commutation). |
| Reactive Power (kVAR) | Power that oscillates back and forth between source and load (inductive/capacitive) without doing work. |
| RMS (Root Mean Square) | The effective value of AC voltage or current, equivalent to the DC value that would produce the same heat. |
| Swell | A temporary increase in voltage (usually > 110%) lasting from half a cycle to a minute. |
| Transient | A sub-cycle disturbance in the AC waveform that is evidenced by a sharp, brief discontinuity (spike). |
Conclusion (next steps)
A Power Quality Analyzer is a critical investment for maintaining the reliability of electrical infrastructure. Whether you are diagnosing a tripping breaker in a factory or designing the next generation of DC Power Analyzer for renewable energy, the accuracy of your data depends on the quality of the underlying hardware.
From the initial schematic to the final assembly, every layer of the PCB matters. High-voltage isolation, thermal management, and signal integrity are not just features—they are requirements for safety and precision.
If you are designing a power analysis device and need a manufacturing partner who understands these stringent requirements, APTPCB is ready to assist. We provide comprehensive support for Energy Industry PCBs, ensuring your design meets the highest standards of reliability.
Ready to move to production? Prepare your Gerber files, stackup requirements, and testing specifications. Contact our engineering team today for a comprehensive DFM review and quote.